
S&P 500 TECHNICAL ANALYSIS
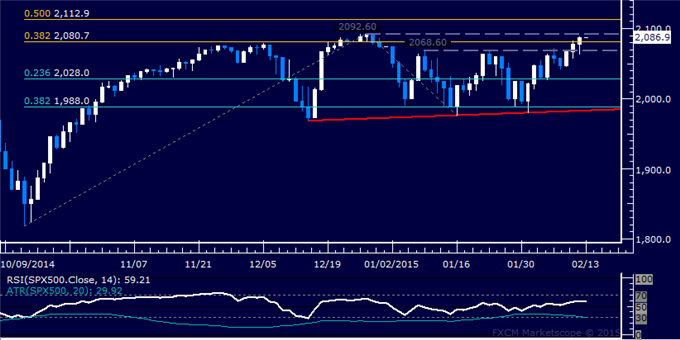
– Prices edged above resistance at 2080.70, the 38.2% Fibonacci
expansion, to expose the December 29 high at 2092.60. A break above that
on a daily closing basis exposes the 50% level at 2112.90.
Alternatively, a turn back below 2080.70 targets
resistance-turned-support marked by the January 9 top at 2068.60.

Click here for comments 0 comments: